
The Monday morning executive meeting starts the same way it always does.
Marketing pulls up the dashboard. Traffic is up 47% month on month. Page views are soaring. Bounce rate is down. The graph lines are all pointing in the right direction, beautiful green arrows climbing toward the sky.
Everyone nods. Someone says “great work.” The meeting moves on.
Three months later, you’re staring at your P&L wondering why revenue barely moved. You spent more on ads. Traffic definitely increased. The numbers looked incredible. So where’s the money?
Welcome to the tyranny of vanity metrics.
At PracticeNext, we’ve seen this pattern destroy more Digital Flagships than bad technology ever has. Companies obsess over metrics that feel good but mean nothing. They optimize for numbers that look impressive in presentations but don’t correlate with the only thing that actually matters: sustainable, profitable growth.
The problem isn’t that you’re tracking the wrong things. It’s that you’re tracking everything, which means you’re focused on nothing.
Your dashboard shouldn’t be a scoreboard. It should be a diagnostic tool. And like any good diagnosis, you need to ignore the symptoms and find the vital signs. Here are the only five that matter.
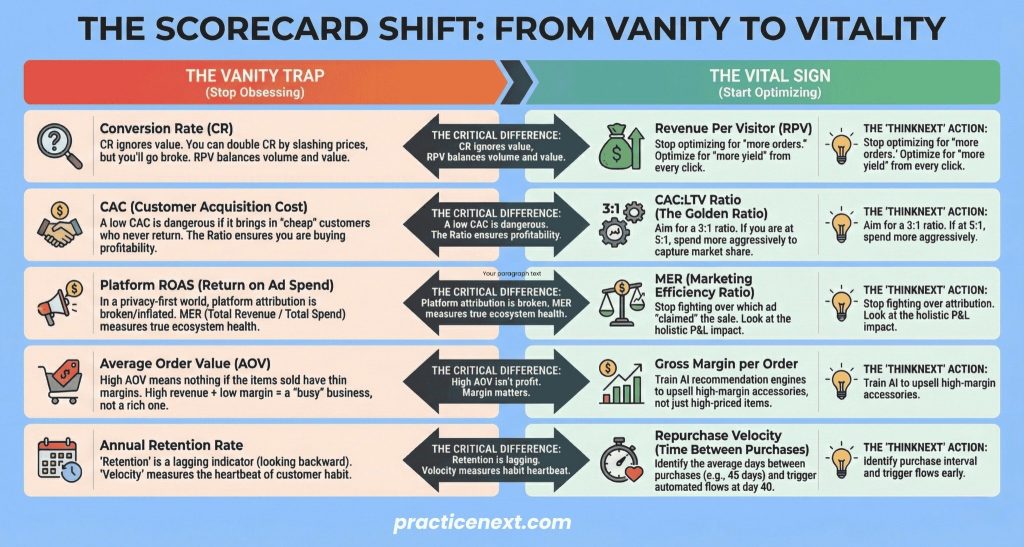
1. Stop Celebrating Conversion Rate. Start Obsessing Revenue Per Visitor.
Let me show you how conversion rate lies.
Tomorrow morning, slash all your prices by 90%. Run a flash sale. Promote it everywhere. By tomorrow afternoon, your conversion rate will double, maybe triple. Orders will flood in. Your analytics will show the best day in company history.
By next month, you’ll be out of business.
Conversion rate is a trap because it ignores value. It treats a $5 impulse buy exactly the same as a $500 considered purchase. High conversion with low value is just expensive failure.
Revenue Per Visitor (RPV) tells the real story. It combines conversion rate with average order value into one metric that actually correlates with your bank account.
Formula: Total Revenue ÷ Total Sessions
What it reveals:
- RPV stagnant while traffic grows? You’re attracting the wrong visitors. Your marketing is generating volume but not value.
- RPV dropping while conversion rate rises? Your discounts are cannibalizing margins. You’re training customers to only buy on sale.
- RPV climbing? You’re attracting the right people and convincing them to buy valuable things. This is the only scenario worth celebrating.
The action: Stop optimizing for conversion in isolation. Optimize for RPV. A 5% conversion rate at $80 RPV crushes a 10% conversion rate at $30 RPV. Value beats volume every time.
2. Stop Fixating on CAC. Start Tracking the CAC:LTV Ratio.
Customer Acquisition Cost looks simple. You spent $50,000 on ads. You acquired 1,000 customers. Your CAC is $50. Is that good? You have absolutely no idea.
A $50 CAC is fantastic if those customers are worth $300 in lifetime value. It’s catastrophic if they’re worth $45. Cost without context is meaningless.
The CAC:LTV ratio gives you that context. It tells you if you’re building a business or just buying revenue.
The benchmark: A healthy D2C ratio is 3:1. For every dollar you spend acquiring a customer, they should generate three dollars in lifetime value.
What it means:
- 1:1 ratio? You’re paying to lose money. Every customer acquired is net-negative. This is a death spiral disguised as growth.
- 5:1 ratio? You’re actually underspending. You’re leaving market share on the table. Your competitors are spending more aggressively because the unit economics support it. You should too.
- 3:1 ratio? You’re in the sweet spot. You’re acquiring customers profitably while investing enough to grow.
The insight: This ratio is your gas pedal. It tells your Revenue Architect exactly how hard to push. If the ratio is healthy, spend more. If it’s not, fix the product or the targeting before scaling spend.
Too many brands burn cash scaling broken unit economics. The ratio would have told them to stop.
3. Stop Trusting ROAS. Start Measuring Marketing Efficiency Ratio.
Platform reported ROAS is a beautiful lie.
Meta says it drove $5 in revenue for every $1 spent. Google says the same thing. TikTok claims credit too. You add up all the platform reported revenue and somehow you generated 300% more revenue than your actual bank account shows.
How?
Because in a post cookie, privacy first world (thank you, iOS updates), attribution is fundamentally broken. Platforms double count. They over attribute. They claim credit for sales that would have happened anyway. Optimizing for platform specific ROAS leads you to pour money into bottom funnel retargeting while starving the brand building that actually drives growth.
Marketing Efficiency Ratio (MER), also called Blended ROAS, cuts through the noise.
Formula: Total Revenue ÷ Total Marketing Spend (across all channels)
Why it works: MER doesn’t care which ad got the click. It doesn’t care which platform claims the sale. It just looks at the holistic reality: you spent X on marketing, you made Y in revenue. That’s your efficiency.
What it reveals:
If your MER is healthy (4:1 or better for most D2C brands), your entire ecosystem is working. Your brand halo effect, your organic reach, your paid ads, they’re all functioning together.
If your MER is weak but platform ROAS looks strong? Someone’s lying to you. Usually it’s the platforms.
The action: Use platform ROAS for tactical optimization within each channel. But judge overall marketing health by MER. It’s the only metric that can’t be gamed by attribution models.
4. Stop Chasing AOV. Start Maximizing Margin Per Order.
Here’s a question: would you rather have a $100 order with 15% margin, or a $70 order with 60% margin?
If you’re optimizing for Average Order Value, you’d pick the first one. You’d be wrong.
The $70 order generates $42 in gross profit. The $100 order generates $15. You made almost 3x more actual money on the “smaller” order.
This is why AOV is a trap. You can easily inflate it by bundling products, offering upsells, pushing higher-priced SKUs. But if those additions are heavily discounted or low margin items, you’re just generating busy work.
High revenue with low margin isn’t a business. It’s a hobby with overhead.
Average Gross Margin Per Order is the cash flow reality check.
The action: Audit what you’re actually recommending. Your AI-powered product recommendations should optimize for margin contribution, not just order size.
A $20 accessory with 80% margin ($16 profit) is often better for your bottom line than a $50 item with 10% margin ($5 profit). Your “frequently bought together” bundles should be “high-margin bought together” bundles.
Stop measuring how much customers spend. Start measuring how much they let you keep.
5. Stop Reporting Retention Rate. Start Tracking Repurchase Velocity.
Your annual retention report says “30% of customers made a second purchase.” Congratulations?
That number tells you almost nothing useful. When did they come back? How long did it take? Are they coming back faster or slower than they used to?
“30% retention” is a rear-view mirror metric. By the time you see it, the damage is done.
Repurchase Velocity measures the heartbeat of habit. It tells you the average time between purchases. More importantly, it tells you when that rhythm breaks.
Why it matters:
If your average customer repurchases every 45 days, and someone is on day 60 without buying, they’re not “retained” yet—they’re already gone. Your annual retention metric just hasn’t caught up to reality.
But if you know the velocity is 45 days, you can trigger intervention at day 40. A personalized email. An SMS reminder. A small incentive. You catch them before they drift.
The compounding power: If you can shorten repurchase velocity from 45 days to 35 days, you’ve added an entire extra purchase cycle per customer per year. Not by acquiring more customers. Not by spending more on ads. Just by accelerating the natural rhythm of the relationship.
The action: Segment by product category or customer cohort. Consumables have different velocities than durables. First-time buyers have different patterns than loyalists. Know your normal, track deviations, intervene intelligently.
This is where AI personalization actually earns its keep, not in showing slightly different hero images, but in predicting and accelerating repurchase before customers churn.
The Dashboard Diet
You’ve built the Digital Flagship. You’ve restructured around Growth Squads. You’ve invested in cutting-edge technology.
Now comes the hardest part: discipline.
Your analytics platform can track hundreds of metrics. It will happily show you heatmaps and session recordings and funnel visualizations and cohort analyses and multivariate test results until your eyes glaze over.
Ignore 95% of it.
Those five metrics: RPV, CAC:LTV, MER, Margin Per Order, Repurchase Velocity, are the vital signs of a healthy commerce business. Everything else is either a derivative, a diagnostic, or a distraction.
When RPV climbs, you’re generating more value per visitor. When CAC:LTV stays healthy, your growth is profitable. When MER improves, your marketing ecosystem is strengthening. When margin per order grows, you’re keeping more of what you earn. When repurchase velocity accelerates, you’re building habit.
That’s the game. That’s the whole game.
Stop celebrating vanity spikes in metrics that don’t matter. Stop building dashboards with 47 different KPIs that no one actually uses to make decisions. Stop having Monday morning meetings where everyone nods at green arrows that don’t correlate with actual profit.
Pick five numbers. Track them religiously. Build systems that move them in the right direction. Let everything else fade into the background noise it always was.
Your Digital Flagship has the technology to track everything. The competitive advantage lies in choosing what to ignore. Because in the end, only one metric actually matters: sustainable, profitable growth. These five vital signs are just the fastest way to see if you’re getting there.


Pingback: Why Your Website Is No Longer Your Storefront I ThinkNext
Pingback: 2026 State of eCommerce India: Trends & Outlook I ThinkNext